A few days ago I told you how to know the speed of a HDD using the command ddWell, this time I will show you a tool that helps us benchmark many things, but today we will only use it to CPU performance.

Installing sysbench
This tool (sysbench) does not serve as I said before, to benchmark various things (I / O, CPU, MySQL, etc), this time we will only use it for the CPU, first obviously ... we must install it:
On systems like Debian, Ubuntu or similar:
sudo aptitude install sysbench
In ArchLinux and derivatives:
yaourt -S sysbench
Using sysbench to measure CPU performance
Now we only have to run it with admin privileges and with the appropriate parameters:
sysbench --test=cpu --cpu-max-prime=20000 run
what does this mean?
- We will do a CPU test
- The number must be such that the test lasts at least 10 seconds, 20000 is a value that should serve them.
Here are several outputs from my PC and some servers that I manage:
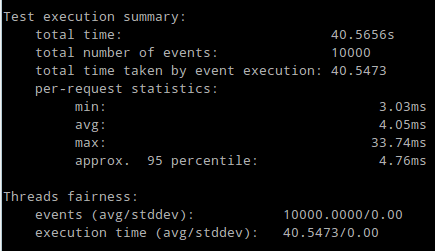

How to check CPU performance
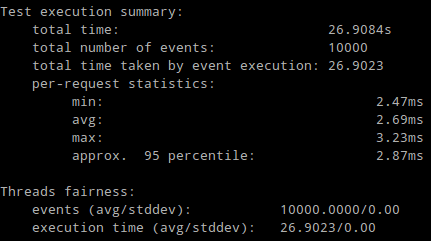
That is, in the 1st screenshot it is seen that the CPU completed the test in 40.5 seconds, the second shows that it completed it in 46.5 seconds, while the 3rd and last screenshot indicates that the test was completed in 26.9 seconds.
This means that the 3rd CPU is the fastest, because it completed the test in less time than the others, Simple or not?
By the way, if you are thinking that a server / computer with 8 cores and another with only 4, the 8-core one will always complete the test faster because it has more ... you are in error, the test runs on a single core, that is , the amount does not matter here 😉
Well that's all, I hope it has been useful for you, I keep running tests on the GNUTransfer VPS 😀
It does not make much sense to run a single core test on a server considering that most of the tasks that it will perform will use several cores.
It is often necessary to know, regardless of the number of cores, which is the CPU that offers the best performance.
Quantity is not everything, quality is often more important.
With this test you will be able to know how much iPC has the processor and based on that you will be able to choose how many cores you are going to have…. simple
In these examples you can see how you can select the number of threads that run the test to squeeze out all possible cores:
http://raspberryparatorpes.net/rivales/sysbench-raspberry-pi-vs-odroid-vs-banana-pro/
totally agree for me it would be more real a bech k will occupy all the cores together
And in case you want to compare a series of tests with mini PC ARM, Raspberry Pi, ODROID and Banana PRO with something low level:
http://raspberryparatorpes.net/rivales/sysbench-raspberry-pi-2/
http://raspberryparatorpes.net/rivales/sysbench-raspberry-pi-vs-odroid-vs-banana-pro/
Good article, by the way since you say it is for servers you could put it for centos
By any chance the screenshot in the middle will not be the GNU transfer?
The first two are from GNUTransfer 😀
Test execution summary:
total time: 21.6028s
total number of events: 10000
total time taken by event execution: 21.6020
per-request statistics:
min: 2.14ms
avg: 2.16ms
max: 5.56ms
approx. 95th percentile: 2.24ms
Thread fairness:
events (avg / stddev): 10000.0000 / 0.00
execution time (avg / stddev): 21.6020 / 0.00
Test execution summary:
total time: 19.7614s
total number of events: 10000
total time taken by event execution: 19.7599
per-request statistics:
min: 1.91ms
avg: 1.98ms
max: 5.73ms
approx. 95th percentile: 2.08ms
Thread fairness:
events (avg / stddev): 10000.0000 / 0.00
execution time (avg / stddev): 19.7599 / 0.00
This is good then? it is an fx 8120.
Running the test with the following options:
Number of threads: 1
Doing CPU performance benchmark
Threads started!
Done.
Maximum prime number checked in CPU test: 20000
Test execution summary:
total time: 108.2065s
total number of events: 10000
total time taken by event execution: 108.1852
per-request statistics:
min: 9.02ms
avg: 10.82ms
max: 54.76ms
approx. 95th percentile: 16.91ms
Thread fairness:
events (avg / stddev): 10000.0000 / 0.00
execution time (avg / stddev): 108.1852 / 0.00
Mine seems very slow to you, right?
the good thing would be to put several systems, especially rasberry orange pi etc, and see the big / not so big differences.