Those of us who work a lot in the terminal, either on our own computer or with servers, often need to see the performance of the equipment, consumption of
RAM, processes that consume the most, CPU, etc., for this there are several alternatives, several programs that we can use to display this information (and more) in the
terminal.
Top:
To run it in a terminal type the following and press Enter:
top
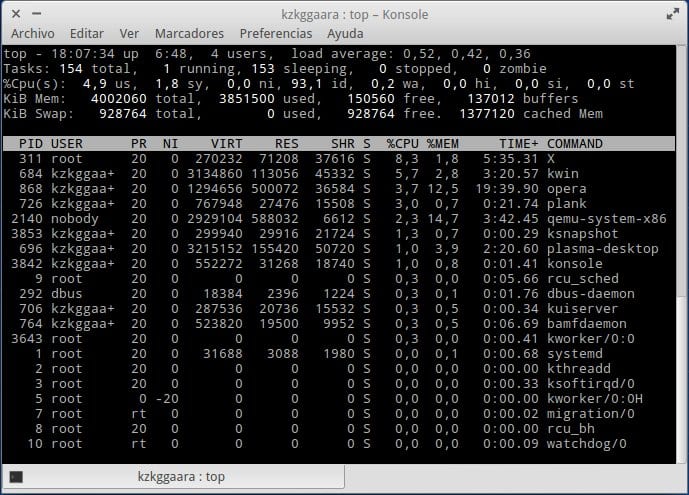
This is the simplest, it is installed by default in many distros and it shows us a lot of different information. For example, it shows us the number of users
assets, online time, also as we can see it shows us the amount of tasks or processes (Tasks: 154 total), the amount of them that are in
running, sleeping, detained or in zombie mode.
Below we see (in KiB) the amount of RAM being used (and free), just like the SWAP
Finally we have a list of the processes, of each one we can know the PID, user who executes it, amount of memory (real and virtual) that it uses, percent
CPU consumption, execution time and specific command / process.
As you can see it is a bit uncomfortable to read this information, however, if you press Z will be able to see the information with colors, which does a little
simpler to read all this data:

To get out of top just press Q and it will close.
htop:
To run it in a terminal type the following and press Enter:
htop
In several distros it is installed by default, in others (like ArchLinux) not, so if it is not opened with the previous command then they must install it.
If they use Ubuntu, Debian or derivatives it would be:
sudo apt-get install htop
If they use ArchLinux or derivatives it would be:
sudo pacman -S htop
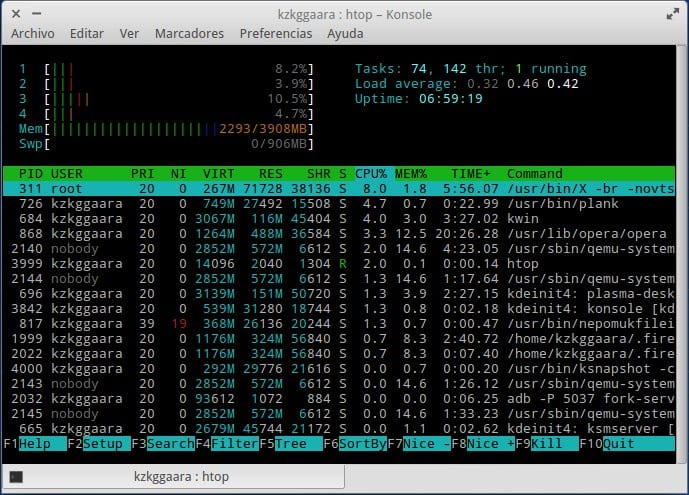
As you can see, this shows us the more ordered information, less stuck, it is easier to read everything. It shows us almost the same as the previous top, no
However, in a better way to read it (even with 'bars' for the consumption of CPU, RAM and SWAP), but !, it offers us other options that you can see below.
These options can be used by pressing the keys F1 ... F2 ... and so on until F10, these allow us
search for specific processes in the list, see them arranged as a tree (processes and threads or associated processes), filter by those with more CPU or RAM
consume, kill processes, etc.
To get out of top just press F10 and it will close.
nmon:
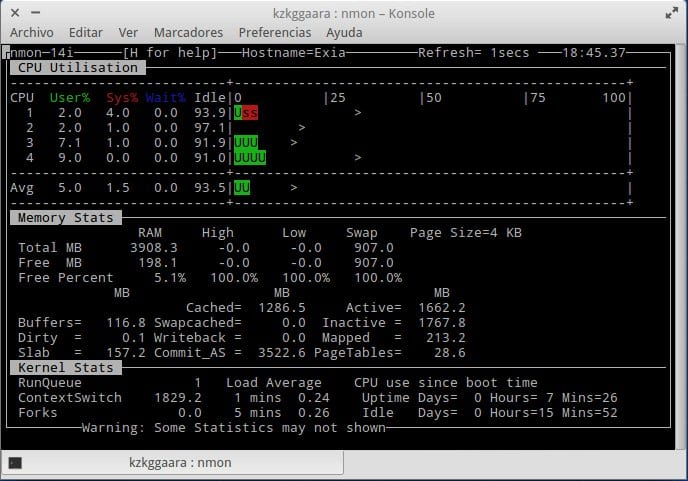
This allows us to further customize the information that it shows us, when we open it it shows us several options, to put it simply, it gives us the
information in a modular way, that is, if we want it to only show us the info related to the CPU, we press a key, if we want it to also show us
In addition, the one related to RAM, we press another key, here is the screenshot of the home screen:

As you can see, if you want to see the information related to the CPU press the key c … The one related to the memory key m ...
with hard drives the d ... the kernel k ... the network n (lowercase), etc.
I leave you the combination of nmon + c + m + k
This should be installed, if you use Ubuntu, Debian or derivatives it would be:
sudo apt-get install nmon
If they use ArchLinux or derivatives it would be:
sudo pacman -S nmon
To get out of top just press Q and it will close.
The end!
Well this has been it. If any of you know any other terminal system monitor, let me know in a comment in real time 🙂
regards
long live htop! I would like to emphasize the main difference that affected me the most compared to top: in top the RAM consumption that marks you is the total, while in htop, and thanks to the colors, you clearly differentiate the active RAM from the passive one (green and yellow), being able to clearly see the total consumption on the bar and differentiate the real consumption (which would be the active one) from the temporary memory content (passive)
mmm I had to change the useragent to get me a manjaro ... is there a way not to overwrite the entire useragent? That is, when I override it, I have to take care of updating my version of Firefox (for example) since some pages for compatibility look at the version you use through the useragent, and when overwriting the default I have to edit it by hand each time . What I'm asking is if there is any way to "append" a word to the default useragent, or even just change one of the fields
I did not know nmon, good data 😀
Sandy .. .. 'copypasteaste' in the nmon .. ..we shouldn't install htop again .. ..but effectively nmon .. 😉
There is an error in the nmon installation code (which by the way I did not know) Thanks for the info.
Thanks for noticing, on Twitter they told me anyway hahaha. I fixed it.
Top is also interactive.
For example, pressing "m" orders the processes by consumption of ram memory (by default it comes in order of CPU). Pressing again returns to the CPU order.
Pressing «k» (for kill) asks us for a PID to enter and kill the process
Pressing «u» (for user) asks us for a user and will make a filter with the one we enter.
Pressing "h" helps. You have a lot of options.
Then as a recommendation for a system monitor in the terminal it would be glances.
It is more or less a mix of the top + free + ifconfig and other commands. In other words, it lists the active processes, plus the information of the network interfaces, plus the activity of the disks / partitions, plus some data from sensors. Is very complete. It is not interactive, but it is "configurable on the fly".
Thanks for improving this thread 😀
Excellent. I'll take a look at the top man.
Every day I like the console more and its programs seem to me the pinnacle of programming, tomorrow I'll take a walk around nmon!
Excellent info, thank you!