![]()
Hello everyone. This time I bring you this very useful tool and unknown by many, to be able to monitor and monitor the activity of our servers all from the same place.
Many are the tools that do this completely or in part, in other cases we must install several to obtain the benefit we are looking for.
The truth is that zabbix works under the model of a single version for which you don't pay a penny and it has a good community. But as always, if you prefer or have the resources for a service and / or support contract as well as a very good training to use the tool, I would tell you that it is not a bad investment.
Well particularly this tool is only for distributions based on debian, ubuntu, redhat. So maybe it is limiting for some, as they will probably have to refer to the sources to compile.
Ok, now we go with the tutorial fully. I did this installation on debian 8 jessie. A clean server with the database on another server, but that is up to everyone.
Step 1:
Download zabbix server and frontend from here
Another alternative is directly from your server.
wget http://repo.zabbix.com/zabbix/3.0/debian/pool/main/z/zabbix/zabbix-server-pgsql_3.0.2-1+jessie_amd64.deb .
 wget http://repo.zabbix.com/zabbix/3.0/debian/pool/main/z/zabbix/zabbix-frontend-php_3.0.2-1+jessie_all.deb .
We install these packages and resolve the dependencies.
dpkg -i *.deb
 apt-get install -f
Step 2:
We add the name of our server example zabbix.mydomain.com
vi /etc/hostsWe add for example:
192.168.1.100 zabbix zabbix.mydomain.com
By default zabbix installs in our apache an alias configuration in /etc/apache2/conf-enabled/zabbix.conf, to access as follows http: // / zabbix, I don't like it so we could disable
a2disconf zabbix.confStep 2.1 (optional- if you left the previous configuration as is, skip to step 3)
Additionally or optionally you would have to create a virtualhost or modify the 000-default.conf as you prefer and add the following
vi /etc/apache2/sites-available/zabbix.midominio.com.conf
<VirtualHost *:80>

ServerName zabbix.midominio.com

DocumentRoot /usr/share/zabbix

<Directory "/usr/share/zabbix">
Options FollowSymLinks
AllowOverride None
Order allow,deny
Allow from all

<IfModule mod_php5.c>
php_value max_execution_time 300
php_value memory_limit 128M
php_value post_max_size 16M
php_value upload_max_filesize 2M
php_value max_input_time 300
php_value always_populate_raw_post_data -1
</IfModule>
</Directory>

<Directory "/usr/share/zabbix/conf">
Order deny,allow
Deny from all
<files *.php>
Order deny,allow
Deny from all
</files>
</Directory>

<Directory "/usr/share/zabbix/app">
Order deny,allow
Deny from all
<files *.php>
Order deny,allow
Deny from all
</files>
</Directory>

<Directory "/usr/share/zabbix/include">
Order deny,allow
Deny from all
<files *.php>
Order deny,allow
Deny from all
</files>
</Directory>

<Directory "/usr/share/zabbix/local">
Order deny,allow
Deny from all
<files *.php>
Order deny,allow
Deny from all
</files>
</Directory>
# Available loglevels: trace8, ..., trace1, debug, info, notice, warn,
# error, crit, alert, emerg.

ErrorLog ${APACHE_LOG_DIR}/error.log
CustomLog ${APACHE_LOG_DIR}/access.log combined

</VirtualHost>
We save, go out and run
a2ensite zabbix.midominio.com.conf
service apache2 restart
Step 3:
Setting up the database
aptitude install php5-pgsql
aptitude install libapache2-mod-auth-pgsql
service apache2 reload
The .sql is in
cd /usr/share/doc/zabbix-server-pgsql/create.sql.gzThey can load it by pgadmin3 or by pgsql
by psql
su - postgres
psql
CREATE USER zabbix WITH PASSWORD 'myPassword';
CREATE DATABASE zabixdb;
GRANT ALL PRIVILEGES ON DATABASE zabbixdb to zabbix;
\q
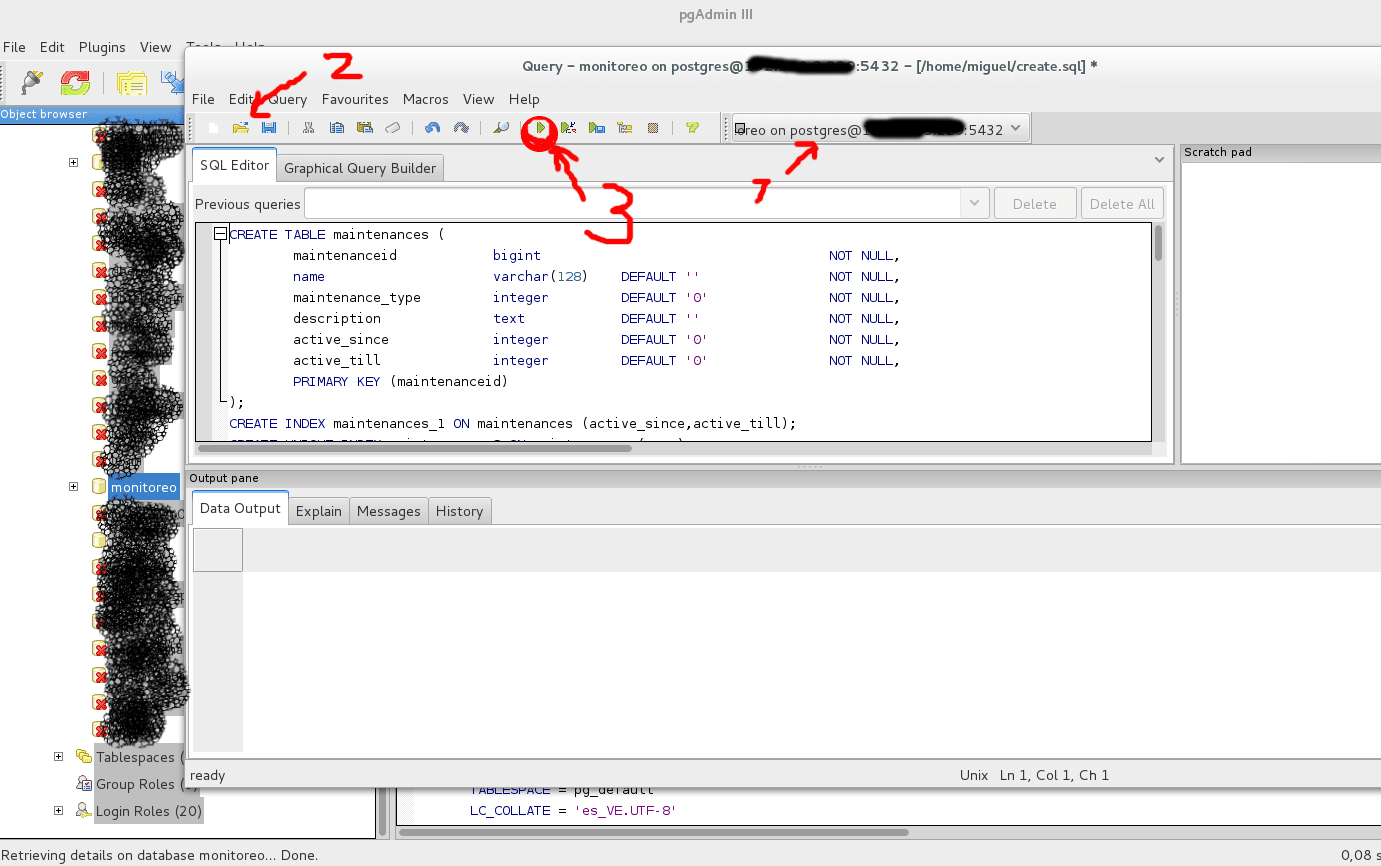
psql -U zabbix -d zabbixdb -f create.sqlBy PgAdmin3 it is much simpler
1 press sql, and check that you are in the correct database
2 press open and load the .sql that is inside the .gz
3 run, and you're done
vi /etc/zabbix/zabbix_server.conf

DBHost=192.168.x.x
 DBName=zabbixdb
 DBSchema=public
 DBUser=zabbix
 DBPassword=password
Step 5:
http://<server_ip_or_name>/zabbix
o
http://<server_ip_or_name>

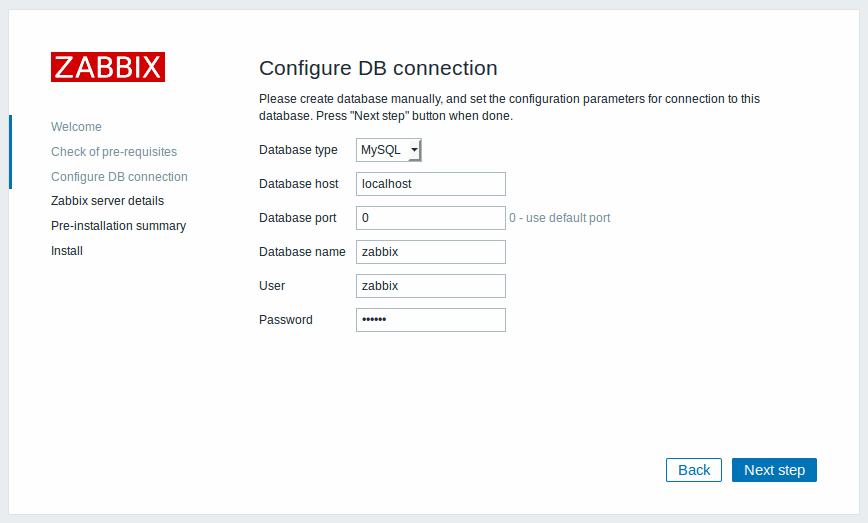
good at this point if we went for mysql or postgres we must check that everything is in green and our database option is shown. Something important about the php time zone can be edited in /etc/php5/apache2/php.ini In the label date.timezone = America / Curacao for example, all permitted zones are here


Then we must configure the database, remember to change the host if it is on another server, as well as user, password and database name

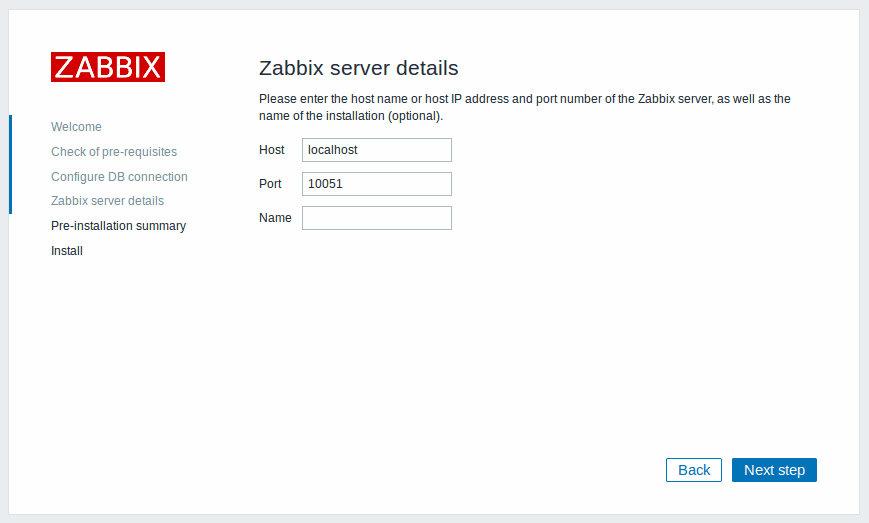
In host, if you have a domain on your server, put it, and in name the diminutive, example, host: zabbix.mydomain.com, and in name: zabbix

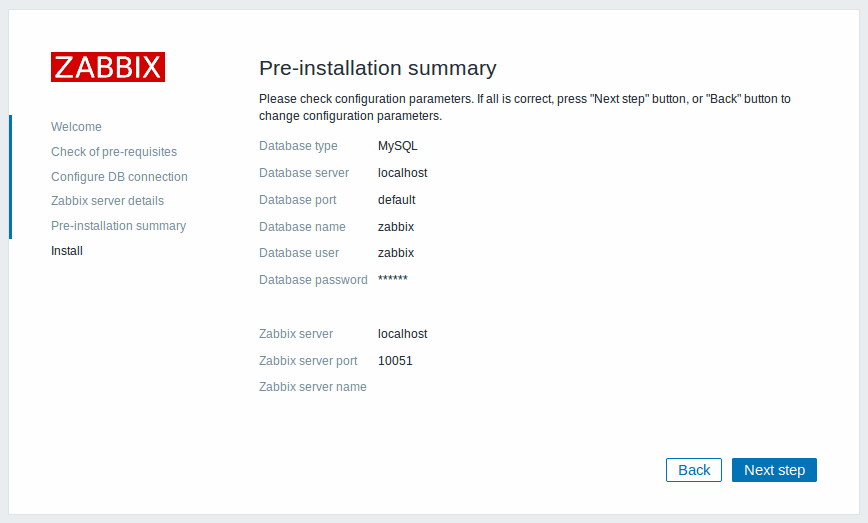
And if you agree, next and you should tell us ...
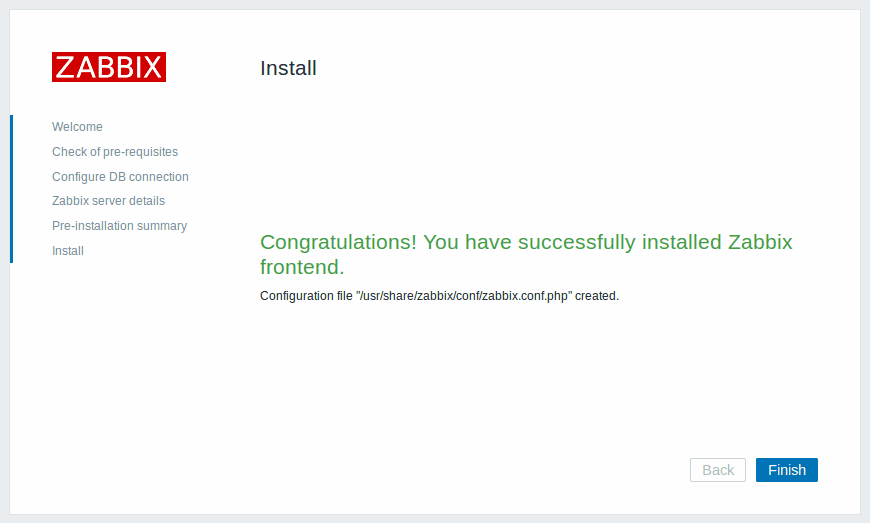
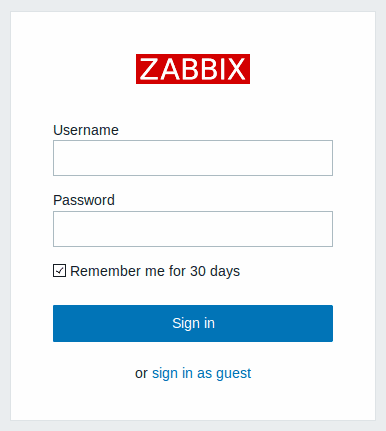
now we only access zabbix.mydomain.com
Step 6:
We install the client on our server
wget http://repo.zabbix.com/zabbix/3.0/debian/pool/main/z/zabbix/zabbix-agent_3.0.2-1+jessie_amd64.deb .
 dpkg -i zabbix-agent_3.0.2-1+jessie_amd64.deb
 /etc/init.d/zabbix-agent start
Step 7:
I'm going to explain in this tutorial the most basic things to add a client, because by default zabbix server has configured several templates, triggers, action etc ... in a second post I will show you this topic in more depth
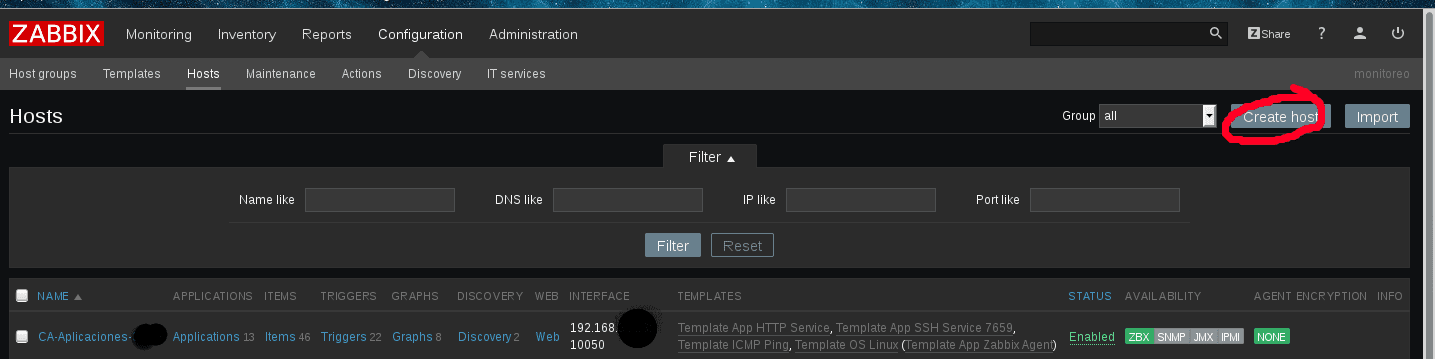
Configuration> Hosts> Create host

hostname is the exact name that you must put in zabbix_agentd.conf, this name is usually more technical ... example srv-01, that doesn't tell me anything, not even a description of the server
visible name It is already a more friendly name that allows you as an administrator to know which server it is ... example Mail
Groups is which group this hos belongs to, or you can create a new one in New group
Agent interfaces, you can monitor from more than 1 interface, but at least one must be declared by ip address I dns name
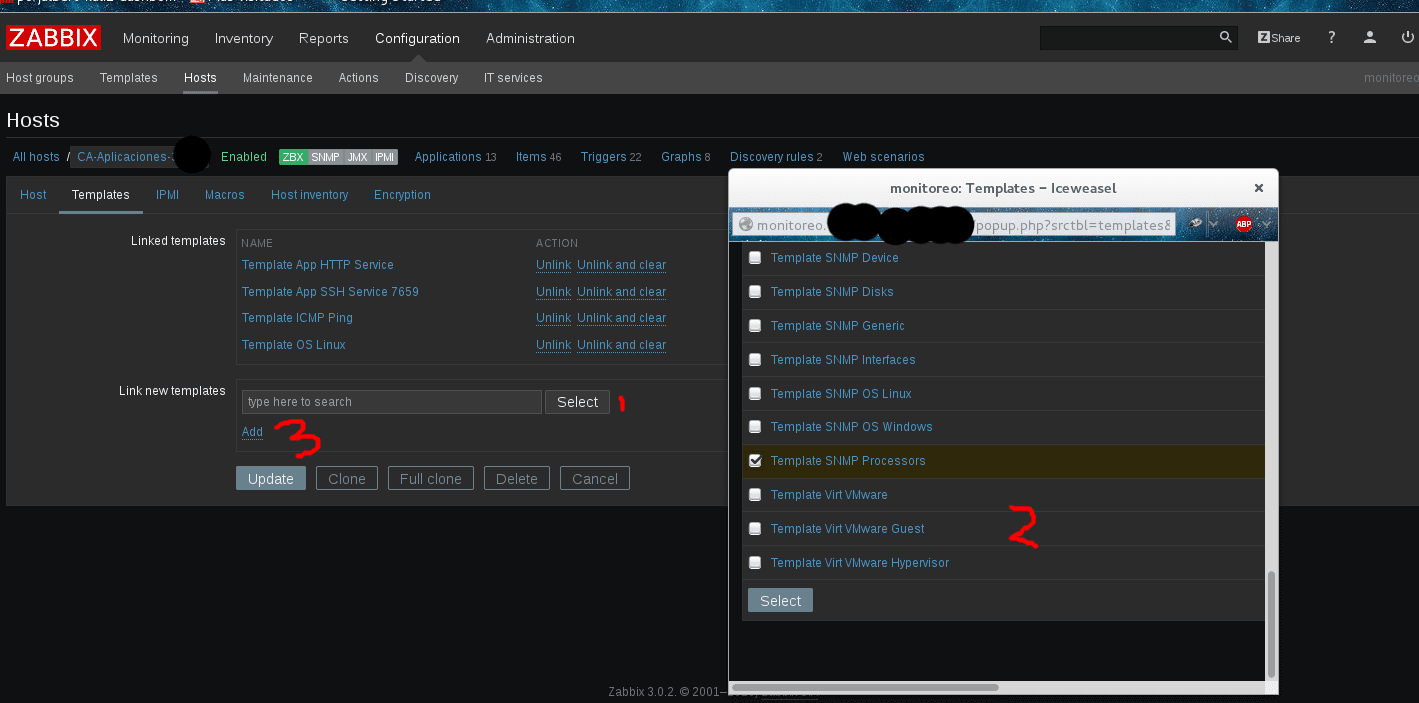
Then we give template and as I mentioned, it already has many already declared by default, such as http / https, ssh, icmp and even some that include several templates in one, such as OS Linux.
First you press Select, then check all the templates you need and press select from that new window, finally add
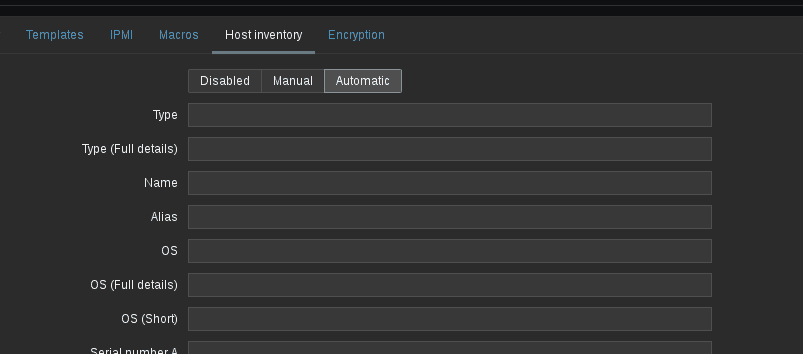
As a last step, I recommend activating Host inventory Automatic
Now to finish on the server that we want to monitor and we already declare on the server, we edit the agentd file
vi /etc/zabbix/zabbix_agentd.conf
Server= ip del servidor
ServerActive=ip del servidor
Hostname=el nombre hostname que colocamos en la configuracion host del server, tiene que ser exactamente igual, mayusculas, espacios, simbolos, sino te dará un error
/etc/init.d/zabbix-agent start
This is all for this opportunity in a second version of this tutorial, I plan to go into depth with all the trigers, actions and functions that you can exploit from this application. Thanks and stay tuned
This tool sounds excellent, I look forward to the second post.
At first glance it seems to be a complete and powerful tool. I will try to configure it shortly.
Thanks for the information!
I am very interested in testing monitoring tools and would like to know which ones you think are the best.
I already knew about Zabbix, but it seems a bit complex to me because of my knowledge, although I will give it another chance by following (as far as I can) the steps of this and the other articles that arrive (Thank you!). Make it as affordable as possible please :))
Another tool that I find very interesting is: GRAFANA that I also have to try. Another good one I think is: NAGIOS
Do you know others that are a reference in data monitoring and visualization that are relatively simple to implement?
I use CACTI and have done tests with Pandora FMS and ntop
Great tutorial! looking forward to the second part. Nice job