It does not matter if it is used Nginx, Apache, Lighttpd or other, any network administrator who has a web server will want at some point to know how fast the web server responds to a given number of queries.

Apache Benchmark + GNUPlot
This time we will use a tool called Apache Benchmark, which although it has 'apache' in its name, is NOT just for measuring Apache performance, but can also be used for Nginx and others. Actually, I'll use it to measure the performance of Nginx.
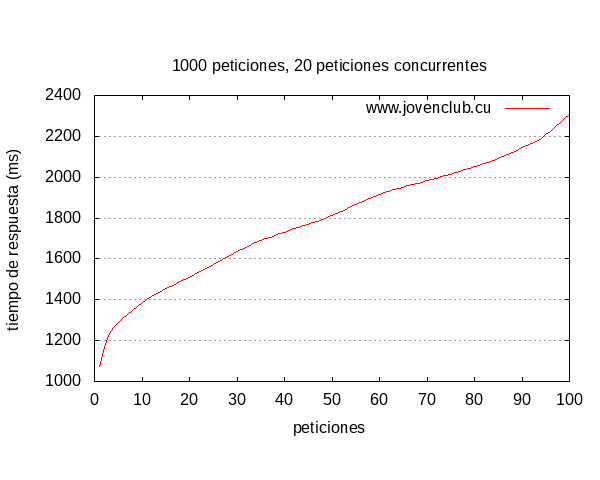
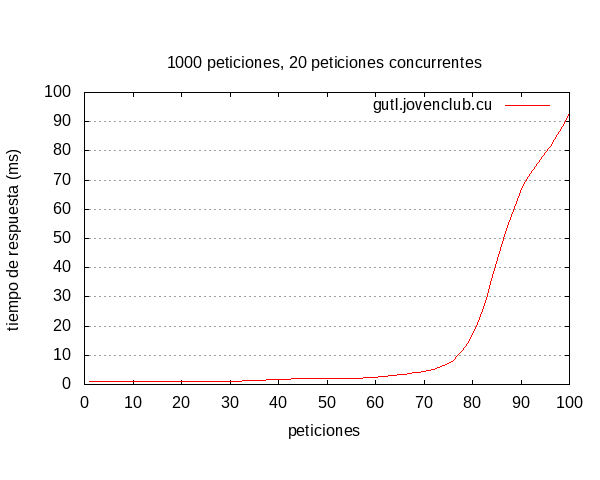
We will also use GNUPlot, which will help us to make graphs like these with a few lines:
Installing Apache Benchmark and GNUPlot
Apache Benchmark is a tool that we can use after installing the Apache package, GNUPlot will be available after installing the package of the same name. So then ...
On distros like Debian, Ubuntu or similar:
sudo apt-get install apache2 gnuplot
In distros like ArchLinux or derivatives:
sudo pacman -S apache gnuplot
Using Apache Benchmark
What we will do is send a specific number of requests (100) in groups of several (from 20 to 20) to a specific site. We will save the result in a .csv file (result.csv) and then process it with GNUPloit, the line would be:
ab -g resultados.csv -n 100 -c 20 http://nuestro-sitio-web.com/
This is the output or log that shows me when I test a site on my network:
This is ApacheBench, Version 2.3 <$ Revision: 1638069 $> Copyright 1996 Adam Twiss, Zeus Technology Ltd, http://www.zeustech.net/ Licensed to The Apache Software Foundation, http://www.apache.org/ Benchmarking gutl.jovenclub.cu (be patient) ..... done

Server Software: nginx Server Hostname: gutl.jovenclub.cu Server Port: 80

Document Path: /
Document Length: 206 bytes Concurrency Level: 20 Time taken for tests: 0.101 seconds Complete requests: 100 Failed requests: 27 (Connect: 0, Receive: 0, Length: 27, Exceptions: 0) Non-2xx responses: 73 Total transferred: 1310933 bytes HTML transferred: 1288952 bytes
Requests per second: 993.24 [# / sec] (mean)
Time per request: 20.136 [ms] (mean) Time per request: 1.007 [ms] (mean, across all concurrent requests) Transfer rate: 12715.49 [Kbytes / sec] received Connection Times (ms) min mean [+/- sd] median max Connect: 0 1 0.2 1 1 Processing: 1 17 24.8 4 86 Waiting: 1 15 21.5 4 76 Total: 1 18 24.8 5 87 Percentage of the requests served within a certain time (ms) 50% 5 66% 6 75% 22 80% 41 90% 62 95% 80 98% 87 99% 87
100% 87 (longest request)
I have marked in red what I consider to be the most important thing, which has been more or less:
- Data of the server we are testing, as well as the URL in question.
- Number of requests per second.
- How many milliseconds it took the server to attend the request that took the longest, that is, the one that took the longest to be answered.
With this information, they can have an idea of how long it will take for the server to attend that number of requests, they can then add a better cache system, deactivate modules that they do not use, etc etc, run the test again and see if performance improved or not .
Other useful Apache Benchmark options or parameters:
-k -H 'Accept-Encoding: gzip, deflate' : With this ab will accept the cache and compression that the server has configured, so the times will be lower.
-f urls.txt : So instead of just testing the site's index, it will carry out tests on the URLs that we specify in that file.
Anyway ... take a look at man ab for you to see.
Show the result in a graph:
To put this output in an image, that is, in a more visual medium and that many times, it is everything that managers manage to understand ... for this we will use as I said before, GNUPlot
In the same folder where we have the file results.csv (remember, we just generated with the above command) we are going to create a file called gnuplot.p:
nano plot.p
In it we will put the following:
set terminal png size 600 set output "results.png"set title"100 requests, 20 concurrent requests "set size ratio 0.6 set grid and set xlabel"petitions"set ylabel"response time (ms)"plot"results.csv"using 9 smooth sbezier with lines title"gutl.jovenclub.cu"
I have indicated in red what you should always check. That is and from top to bottom:
- Name of the image file to be generated
- Number of total and concurrent requests.
- Name of the file that we just generated.
- Domain we work on.
Once we put that in, save and exit (Ctrl + O and then Ctrl + X), we will execute the following:
gnuplot plot.p
And voila, that will generate the graph with the desired name, mine is:
Apache Benchmark has a lot more options, there are also many combinations that we can use to make our performance test even more complete.
But hey, this has been the basics 😉
Enjoy!
Interesting apache benchmark, what gnuplot did not know is it possible to modify the style of the output? I say as for a formal report.
Greetings from Chile.
Yes, there are a lot of configurations on the net for gnuplot, search Google to see if you find any serious or professional enough for you to use it, because that's everyone's taste gusto
Ummm I'm going to test it right now on a virtual apache server that I have running to see how this goes, with respect to GUTL, as it fires very quickly from 80 requests, right? Let's see that 100 ms does not They are nothing, but the high that gives for 10 more requests compared to 70 to 80 with 80 to 90 catches my attention
It must be due to the queue or number of maximum threads to be attended simultaneously. However, I did the test without gzip, without deflate, without cache or anything 😉
Very interesting, especially for the use of GNUPlot. From what I see it can be used to generate graphs from almost any data set, right? ...
Yes of course, you pass the data in a file separated by commas or something like that, you tell it how to process it in the configuration file, and that's it
Hello, I always spend my time reading this blog but I have never commented on any article, and this seems like a good opportunity.
What I want to share with you is that this type of graph can be misinterpreted, because Apache Bench sorts the result using ttime (total time) instead of sequential time. Although the data is still true, the graph probably does not show what we want.
Here is the link where I read it.
http://www.bradlanders.com/2013/04/15/apache-bench-and-gnuplot-youre-probably-doing-it-wrong/
Greetings.
Apache Benchmark is not the best tool to measure the performance of HTTP servers in computers with multiple cores, in addition, only 100 requests with 20 concurrent connections is a very weak test, something more realistic would be 1,000 or 10,000 requests with 100 concurrent connections (it is known that Nginx is one of the applications capable of serving more than 10,000 requests per second) and for this it is better to use a tool like weighttp, which is designed for multi-core computers and uses epoll which is faster, unlike Apache Bench which it uses a single thread and a less efficient event handling mechanism.
To land my point, assuming the server has only 4 cores:
weighttp -n 10000 -c 100 -t 4 -k "http://our-web-site.com/"
Hello everyone,
When drawing the graph (from the CSV) with gnuplot it gives me the following error, can you tell me how to solve it?
"Plot.p", line 8: warning: Skipping data file with no valid points
plot «graph.csv» using 9 smooth sbezier with lines title «AB - localhost / web»
^
"Plot.p", line 8: x range is invalid
With gnuplot, can I also generate HTML pages?